


Photo: iStock


According to Ember’s new figures, renewable energy sources met almost three quarters of last year’s increase in the world’s electricity demand. Together with nuclear energy, they would have covered almost the entire jump if it wasn’t for the share attributed to the annual increase in temperatures. Looking at it the other way around, the need for additional cooling accounted for the overwhelming part of the rise in fossil fuel use, and at the same time the resulting additional emissions contributed to the acceleration of global warming.
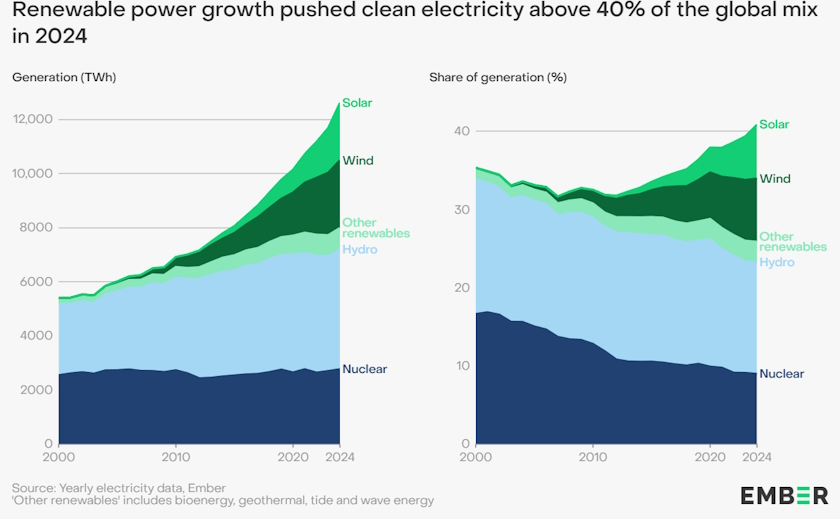
The share of low-carbon sources rose to a historic 40.9% of global output in 2024. Photovoltaics made up 55.2% of renewable electricity production growth. Hungary, Greece and Bulgaria are among the world’s strongest solar power producers while Turkey has one of the highest power demand growth rates.
Taken together, wind and solar power, hydroelectric plants, other renewables and nuclear energy amounted to 40.9% of global electricity generation in 2024. One year earlier, the level was 39.4%. Last year’s share was the highest since the 1940s, when the global electricity system was fifty times smaller, Ember said in its Global Electricity Review 2025.
At the time, there was only hydropower and some biomass on the list. Solar power has been the main factor of change over the past several years, and so has China.
Global electricity demand jumped 4% last year or 1.17 PWh, amplified by heatwaves, and reached an all-time high of 30.9 PWh. Periods of higher temperatures in another hottest year ever drove up demand for cooling. The relative increase in 2023 was 2.6%.
Hydropower remained the largest source of low-carbon electricity (14.3%), followed by nuclear (9%). Wind (8.1%) and photovoltaics (6.9%) are rapidly gaining ground and together they overtook hydro in 2024, while nuclear’s share reached a 45-year low.
Renewables meet 73.2% of growth in world power demand
Renewable power sources accounted for 858 TWh of added output. The previous record of 577 TWh was set two years earlier, as hydropower dropped in 2023, also mostly because of heat.
EVs, heat pumps, data centers and other new drivers of power demand more than doubled their share in annual growth in five years
Renewables met 73.2% of growth in demand and nuclear energy covered 5.9%. Together, they nearly accounted for all growth except the temperature effects, and the rest was from fossil fuels.
Interestingly, looking at it the other way around, the need for additional cooling accounted for the overwhelming part of the rise in fossil fuel use. Of course, the resulting additional emissions contributed to the acceleration of global warming.
Fossil fuel use would have remained almost unchanged if temperatures didn’t grow, the think tank claims. Global power sector emissions rose by 1.6% to a new all-time high of 14.6 billion tonnes of CO2.
But at least the demand for cooling during the day mostly runs in parallel to solar power production. Moreover, the pace of energy storage capacity increase still isn’t keeping up with the growing need to balance photovoltaics and wind power, as they depend on the weather.
However, the update focuses only on one indicator, within the annual growth in power demand. The system is much more complex and fossil fuels weren’t only and directly used for cooling. There is also the matter of distribution across segments from the entire output.
New drivers of demand such as electric vehicles, heat pumps and data centers contributed roughly the same to annual demand growth as the temperature effect, but more than twice as much as they did five years before.
China nearing one third of global electricity demand
China’s electricity demand surged 6.6% or by 623 TWh, which accounted for more than half of the global rise. Its 10.07 PWh in total was 32.6% of the overall figure. Five years before the country was at 28%. Renewables and nuclear energy covered 81% of its demand increase.
China’s per capita electricity use overtook France’s for the first time last year
The United States is number two overall, with 4.4 PWh in 2024 or 14.3% of the global level. China’s per capita electricity use overtook France’s for the first time, and was five times that of India’s.
Turkey’s growth rate, 5.6%, was among the highest on the planet. In absolute terms, demand jumped 18 TWh.
Photovoltaics beat coal power in 2024 in EU
Solar power production spiked by a stunning 29%, which was a six-year high, or by 474 TWh. It covered 40.4% of the whole demand increase. Photovoltaics were the largest segment of new electricity for the third year in a row and grew the fastest for the 20th straight year. Total output reached 2.13 PWh.
Global solar power capacity reached 1 TW in 2022 after decades of growth, but it surpassed 2 TW only two years later. China amounted to 53% of the increase in PV generation in 2024.
Solar power topped coal power output in the European Union for the first time. As for the share of domestic production, Hungary tops the global list, with 25%. Chile is second at 22%, and Greece is third and best, with 22%, among the countries that Balkan Green Energy News mainly tracks.
Bulgaria is also in the main chart, coming in ninth on a global scale, with 14.4%.
As for solar power production per capita, Australia leads by far with 1.87 MWh, followed by the United Arab Emirates (1.29 MWh) and Greece, also at 1.29 MWh on a rounded basis. Hungary is seventh in the category, at 971 kWh per person.
In the rest of Southeastern Europe, Turkey sticks out as tenth on the planet in hydropower output, at 75 TWh. Albania has the fourth-highest share of domestic production, 97%.
Notably, Kosovo* tops the list of coal’s share in electricity production, with 92%. Bosnia and Herzegovina and Serbia still seem pretty much stuck with the technology. They are fifth and sixth, respectively, both at 63% on a rounded basis.


Be the first one to comment on this article.